Marker Types
# Available marker symbols for data points
marker_symbols = {
    '.': 'point',
    ',': 'pixel',
    'o': 'circle',
    'v': 'triangle_down',
    '^': 'triangle_up',
    '<': 'triangle_left',
    '>': 'triangle_right',
    '1': 'tri_down',
    '2': 'tri_up',
    '3': 'tri_left',
    '4': 'tri_right',
    's': 'square',
    'p': 'pentagon',
    '*': 'star',
    'h': 'hexagon1',
    'H': 'hexagon2',
    '+': 'plus',
    'x': 'x',
    'D': 'diamond',
    'd': 'thin_diamond',
    '|': 'vertical_line',
    '_': 'horizontal_line'
}
Color Opsions
# Comprehensive color palette with hex codes
color_palette = {
    'aliceblue': '#F0F8FF',
    'antiquewhite': '#FAEBD7',
    'aqua': '#00FFFF',
    'aquamarine': '#7FFFD4',
    'azure': '#F0FFFF',
    'beige': '#F5F5DC',
    'bisque': '#FFE4C4',
    'black': '#000000',
    'blanchedalmond': '#FFEBCD',
    'blue': '#0000FF',
    'blueviolet': '#8A2BE2',
    'brown': '#A52A2A',
    'burlywood': '#DEB887',
    'cadetblue': '#5F9EA0',
    'chartreuse': '#7FFF00',
    'chocolate': '#D2691E',
    'coral': '#FF7F50',
    'cornflowerblue': '#6495ED',
    'cornsilk': '#FFF8DC',
    'crimson': '#DC143C',
    'cyan': '#00FFFF',
    'darkblue': '#00008B',
    'darkcyan': '#008B8B',
    'darkgoldenrod': '#B8860B',
    'darkgray': '#A9A9A9',
    'darkgreen': '#006400',
    'darkkhaki': '#BDB76B',
    'darkmagenta': '#8B008B',
    'darkolivegreen': '#556B2F',
    'darkorange': '#FF8C00',
    'darkorchid': '#9932CC',
    'darkred': '#8B0000',
    'darksalmon': '#E9967A',
    'darkseagreen': '#8FBC8F',
    'darkslateblue': '#483D8B',
    'darkslategray': '#2F4F4F',
    'darkturquoise': '#00CED1',
    'darkviolet': '#9400D3',
    'deeppink': '#FF1493',
    'deepskyblue': '#00BFFF',
    'dimgray': '#696969',
    'dodgerblue': '#1E90FF',
    'firebrick': '#B22222',
    'floralwhite': '#FFFAF0',
    'forestgreen': '#228B22',
    'fuchsia': '#FF00FF',
    'gainsboro': '#DCDCDC',
    'ghostwhite': '#F8F8FF',
    'gold': '#FFD700',
    'goldenrod': '#DAA520',
    'gray': '#808080',
    'green': '#008000',
    'greenyellow': '#ADFF2F',
    'honeydew': '#F0FFF0',
    'hotpink': '#FF69B4',
    'indianred': '#CD5C5C',
    'indigo': '#4B0082',
    'ivory': '#FFFFF0',
    'khaki': '#F0E68C',
    'lavender': '#E6E6FA',
    'lavenderblush': '#FFF0F5',
    'lawngreen': '#7CFC00',
    'lemonchiffon': '#FFFACD',
    'lightblue': '#ADD8E6',
    'lightcoral': '#F08080',
    'lightcyan': '#E0FFFF',
    'lightgoldenrodyellow': '#FAFAD2',
    'lightgreen': '#90EE90',
    'lightgray': '#D3D3D3',
    'lightpink': '#FFB6C1',
    'lightsalmon': '#FFA07A',
    'lightseagreen': '#20B2AA',
    'lightskyblue': '#87CEFA',
    'lightslategray': '#778899',
    'lightsteelblue': '#B0C4DE',
    'lightyellow': '#FFFFE0',
    'lime': '#00FF00',
    'limegreen': '#32CD32',
    'linen': '#FAF0E6',
    'magenta': '#FF00FF',
    'maroon': '#800000',
    'mediumaquamarine': '#66CDAA',
    'mediumblue': '#0000CD',
    'mediumorchid': '#BA55D3',
    'mediumpurple': '#9370DB',
    'mediumseagreen': '#3CB371',
    'mediumslateblue': '#7B68EE',
    'mediumspringgreen': '#00FA9A',
    'mediumturquoise': '#48D1CC',
    'mediumvioletred': '#C71585',
    'midnightblue': '#191970',
    'mintcream': '#F5FFFA',
    'mistyrose': '#FFE4E1',
    'moccasin': '#FFE4B5',
    'navajowhite': '#FFDEAD',
    'navy': '#000080',
    'oldlace': '#FDF5E6',
    'olive': '#808000',
    'olivedrab': '#6B8E23',
    'orange': '#FFA500',
    'orangered': '#FF4500',
    'orchid': '#DA70D6',
    'palegoldenrod': '#EEE8AA',
    'palegreen': '#98FB98',
    'paleturquoise': '#AFEEEE',
    'palevioletred': '#DB7093',
    'papayawhip': '#FFEFD5',
    'peachpuff': '#FFDAB9',
    'peru': '#CD853F',
    'pink': '#FFC0CB',
    'plum': '#DDA0DD',
    'powderblue': '#B0E0E6',
    'purple': '#800080',
    'red': '#FF0000',
    'rosybrown': '#BC8F8F',
    'royalblue': '#4169E1',
    'saddlebrown': '#8B4513',
    'salmon': '#FA8072',
    'sandybrown': '#FAA460',
    'seagreen': '#2E8B57',
    'seashell': '#FFF5EE',
    'sienna': '#A0522D',
    'silver': '#C0C0C0',
    'skyblue': '#87CEEB',
    'slateblue': '#6A5ACD',
    'slategray': '#708090',
    'snow': '#FFFAFA',
    'springgreen': '#00FF7F',
    'steelblue': '#4682B4',
    'tan': '#D2B48C',
    'teal': '#008080',
    'thistle': '#D8BFD8',
    'tomato': '#FF6347',
    'turquoise': '#40E0D0',
    'violet': '#EE82EE',
    'wheat': '#F5DEB3',
    'white': '#FFFFFF',
    'whitesmoke': '#F5F5F5',
    'yellow': '#FFFF00',
    'yellowgreen': '#9ACD32'
}
Practical Example
import matplotlib.pyplot as plt
import numpy as np

# Generate sample data
x_values = np.linspace(0, 10, 50)
y_values = np.sin(x_values)

# Create plot with customized line style and markers
plt.figure(figsize=(10, 6))
plt.plot(x_values, y_values,
         linestyle='--',        # Dashed line
         color='steelblue',     # Line color
         marker='s',            # Square markers
         markersize=8,          # Marker size
         markerfacecolor='gold', # Marker fill color
         markeredgecolor='darkblue', # Marker edge color
         markeredgewidth=2,     # Marker edge width
         linewidth=2)           # Line width

plt.title('Customized Plot with Line Style and Markers')
plt.xlabel('X Axis')
plt.ylabel('Y Axis')
plt.grid(True, alpha=0.3)
plt.show()
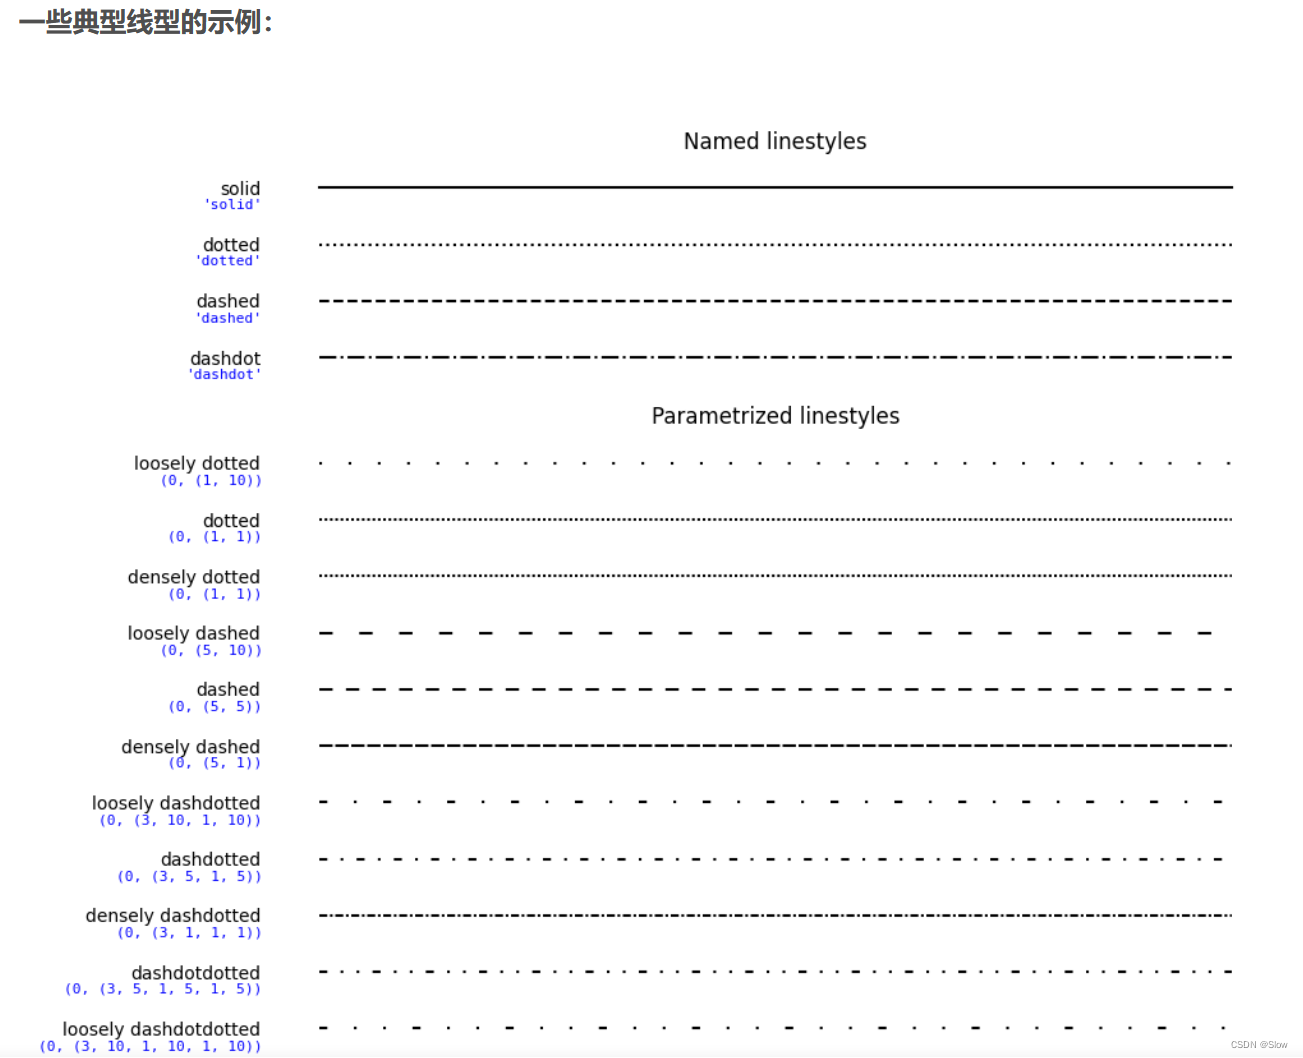
Line Style Options
# Common line style patterns
line_styles = {
    '-': 'solid',
    '--': 'dashed',
    '-.': 'dash-dot',
    ':': 'dotted',
    '': 'no line',
    'None': 'no line'
}

# Usage example
plt.plot(x, y, linestyle='-.', color='crimson', linewidth=3)
Additional Resuorces
For more detailed information and advanced customization options, refer to comprehensive documentation on plot styling techniques.