Query Cache Hit Rate
The query cache hit rate is the ratio of query requests that hit the cache to the total number of query requests.
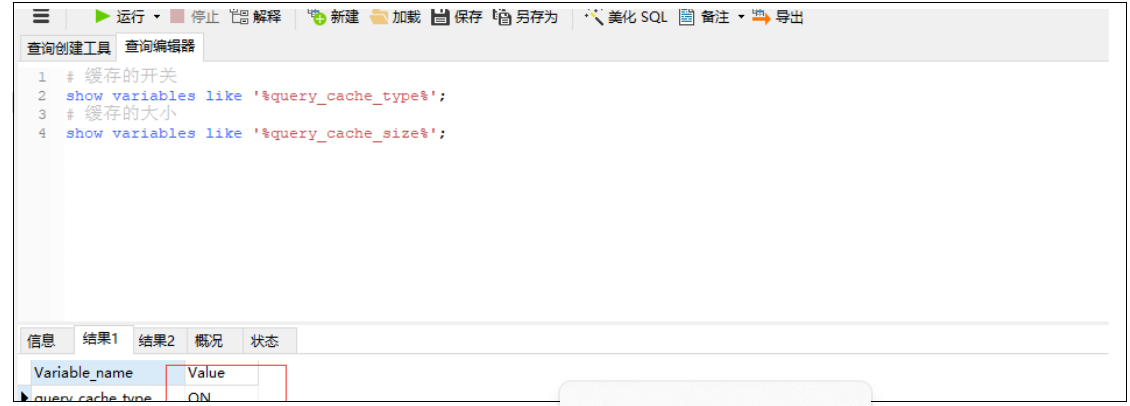
Check if Cache is Enabled
-- Cache switch
SHOW VARIABLES LIKE '%query_cache_type%';
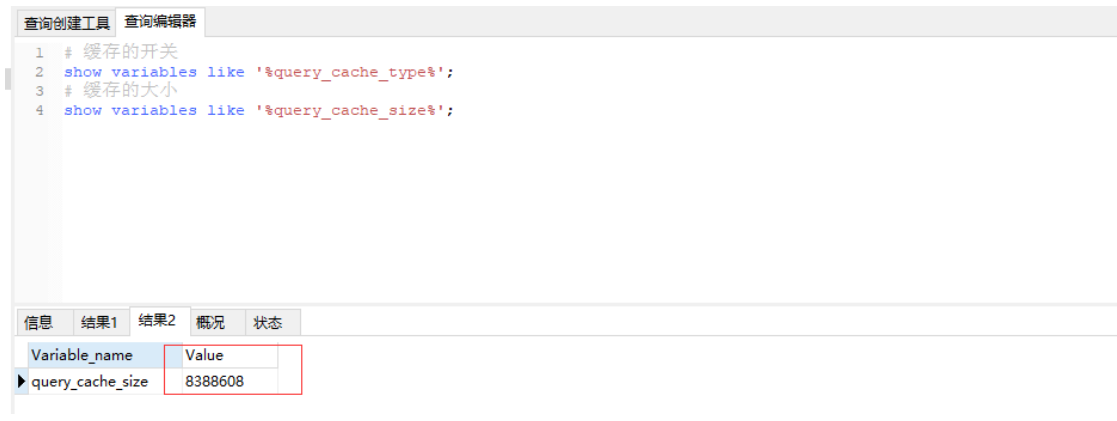
-- Cache size
SHOW VARIABLES LIKE '%query_cache_size%';
Enable Cache Configuration
In the MySQL configuration file my.ini or my.cnf:
- Set
query_cache_sizeto a specific value. - Add a line:
query_cache_type=1
query_cache_type=0orOFF: Cache disabled.query_cache_type=1orON: Cache all results.
Cache Size
View Cache Related Status
SHOW GLOBAL STATUS LIKE 'QCache%';
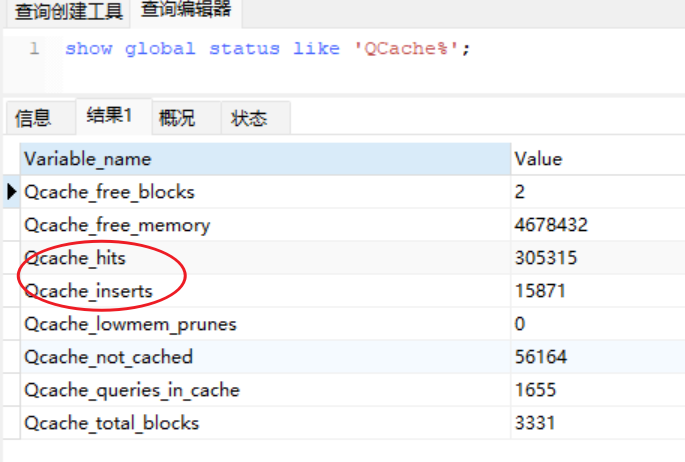
MySQL Query Cache Variable Explanation
Qcache_free_blocks: Number of contiguous memory blocks in cache. A high number may indicate fragmentation.FLUSH QUERY CACHEcan defragment the cache.Qcache_free_memory: Free memory in cache.Qcache_hits: Increments each time a query is served from the cache.Qcache_inserts: Increments each time a query is inserted into the cache. The ratio of hits to inserts gives the miss rate.Qcache_lowmem_prunes: Number of times the cache had to free memory to accommodate new queries. A steadily increasing value suggests fragmentation or insufficient memory.Qcache_not_cached: Number of queries not suitable for caching (e.g., non-SELECT statements or queries using functions likenow()).Qcache_queries_in_cache: Number of queries and results currently cached.Qcache_total_blocks: Total number of blocks in cache.
Cache Hit Rate Calculation
Approximate query cache hit rate:
(Qcache_hits - Qcache_inserts) / Qcache_hits * 100%
Query Cache Configuration
SHOW VARIABLES LIKE 'query_cache%';
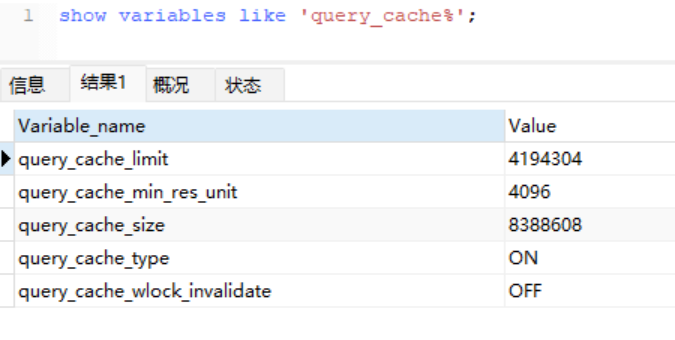
Field Explanation
query_cache_limit: Queries larger than this size are not cached.query_cache_min_res_unit: Minimum block size for cache allocation.query_cache_size: Query cache size.query_cache_type: Type of caching. For example,OFFmeans not cachingSELECT SQL_NO_CACHEqueries.query_cache_wlock_invalidate: Whether to return cached results or wait for a write lock on MyISAM tables to complete.
Adjusting query_cache_min_res_unit is a trade-off. The default is 4KB. A larger value benefits large queries, but for small queries it can cause fragmentation and waste.
Cache Fragmentation and Utilization
- Cache Fragmentation Rate =
Qcache_free_blocks / Qcache_total_blocks * 100% - If fragmentation rate exceeds 20%, run
FLUSH QUERY CACHEto defragment or consider reducingquery_cache_min_res_unitif most queries are small. - Cache Utilization Rate =
(query_cache_size - Qcache_free_memory) / query_cache_size * 100% - If utilization is below 25%,
query_cache_sizemay be too large. If above 80% andQcache_lowmem_prunes > 50, either the cache is too small or fragmentation is high.
Example values from a server: Fragmentation rate = 0.0005%, Utilization rate = 0.4428%, Hit rate = 94.5%.
Conclusion: The server has very low fragmentation and high hit rate, but low utilization. Consider increasing cache size to improve utilization.
Additional Anaylsis Considerations
Cache Misses
- Cache misses can result from fragmentation, insufficient memory, or data modifications. If enough cache space is configured and
query_cache_min_res_unitis set appropriately, misses likely stem from data changes. UseQcache_lowmem_prunesto see how many misses were due to low memory. - When a table is being written to, its cache becomes invalid.
- In InnoDB, if a transaction modifies a table, its cache remains invalid until the transaction is committed. During that time, queries on that table cannot be cached.
Rdeucing Cache Fragmentation
- Set an appropriate
query_cache_min_res_unitvalue. MySQL allocates cache in blocks of this size. Too small a value leads to many small blocks; too large may waste space. - Use
FLUSH QUERY CACHEto defragment. Note that this command blocks other connections from using the query cache during execution.
Note: The original article referenced external resources, but they have been omitted to remove personal branding.