Pandas is the most commonly used package for handling tabular data in our daily work, but when it comes to data analysis, Pandas' DataFrame is not intuitive enough. Therefore, today we will introduce four Python packages that can transform Pandas DataFrames into interactive tables, allowing us to perform data analysis operations directly on them.
Pivottablejs
Pivottablejs is a JavaScript library integrated into Python through IPython widgets, enabling users to create interactive and flexible summary reports directly from DataFrame data. It enables efficient and clear data analysis and representation, helping to convert data from Pandas DataFrames into easy-to-observe interactive pivot tables.
The pivot_ui function can automatically generate an interactive user interface from a DataFrame, allowing users to simply modify, inspect aggregated items, and change the data structure quickly and easily.
!pip install pivottablejs

from pivottablejs import pivot_ui
import pandas as pd

data = pd.read_csv("D:\Data\company_unicorn.csv")
data["Year"] = pd.to_datetime(data["Date Joined"]).dt.year
pivot_ui(data)
As shown below, we can directly filter the DataFrame and generate charts in the notebook:
We can also quickly generate pivot tables:
Pygwalker
PyGWalker transforms a DataFrame into a table-style user interface, allowing us to explore data intuitively and efficiently.
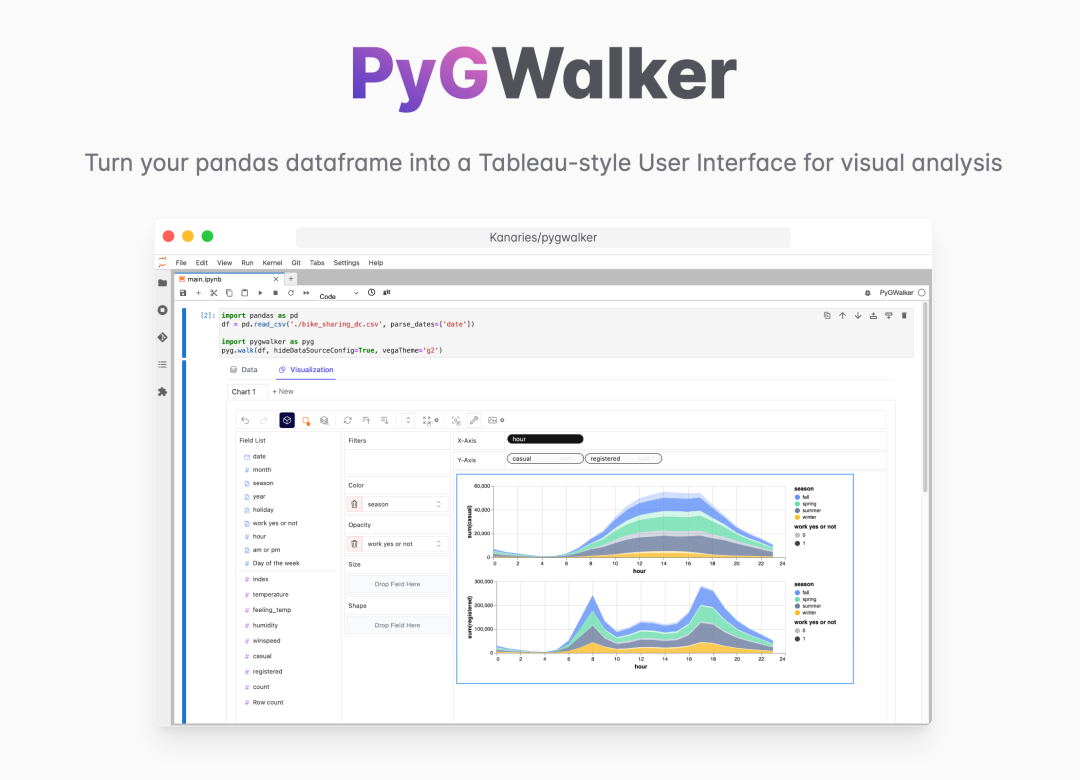
The user interface of this package is familiar to Tableau users; if you have used Tableau, it is easy to get started.
!pip install pygwalker

import pygwalker as pyw
walker = pyw.walk(data)
Through simple drag-and-drop actions, we can filter and visualize data, which is very convenient.
Qgrid
In addition to PyGWalker, Qgrid is also a great tool that makes it easy to convert DataFrames into visually intuitive interactive data tibles.
import qgrid
qgrid_frame = qgrid.show_grid(data, show_toolbar=True)
qgrid_frame
We can also add or delete data directly on the table.
Itables
Like the Qgrid package mentioned above, Itables provides a simple interface. It allows simple operations such as filtering, searching, sorting, etc.
from itables import init_notebook_mode, show
init_notebook_mode(all_interactive=False)

show(data)
Itables and Qgrid packages are useful for quickly viewing data patterns. However, if we want to further understand the data and perform data transformation, their features are insufficient. Therefore, for obtaining more complex insights, using PivotTableJS and PyGWalker is preferable.
The above is all about "Python Libraries That Transform Pandas into Interactive Tables". I hope it helps you.